Track Your Revenue and Sales
See how much money your shop is bringing in, which products are your best sellers, and how your revenue is trending over time.
See how much money your shop is bringing in, which products are your best sellers, and how your revenue is trending over time.
Overview
Your Stats page includes a Sales tab and a Products tab that together give you a complete picture of your shop's financial health. You can check your total revenue, average order value, and see exactly which items are earning the most — all in one place.
Steps
1. Open the Stats page
Direct link: Open this page
From your admin sidebar, click Reports to expand the section, then click Stats. The Sales tab opens by default.
2. Choose a time period
Use the buttons at the top right to pick the time range you want to look at:
- 7 days — the past week
- 28 days — the past four weeks (selected by default)
- 12 months — the past year
- YTD — year to date
All the numbers and charts on the page update automatically when you switch time periods.
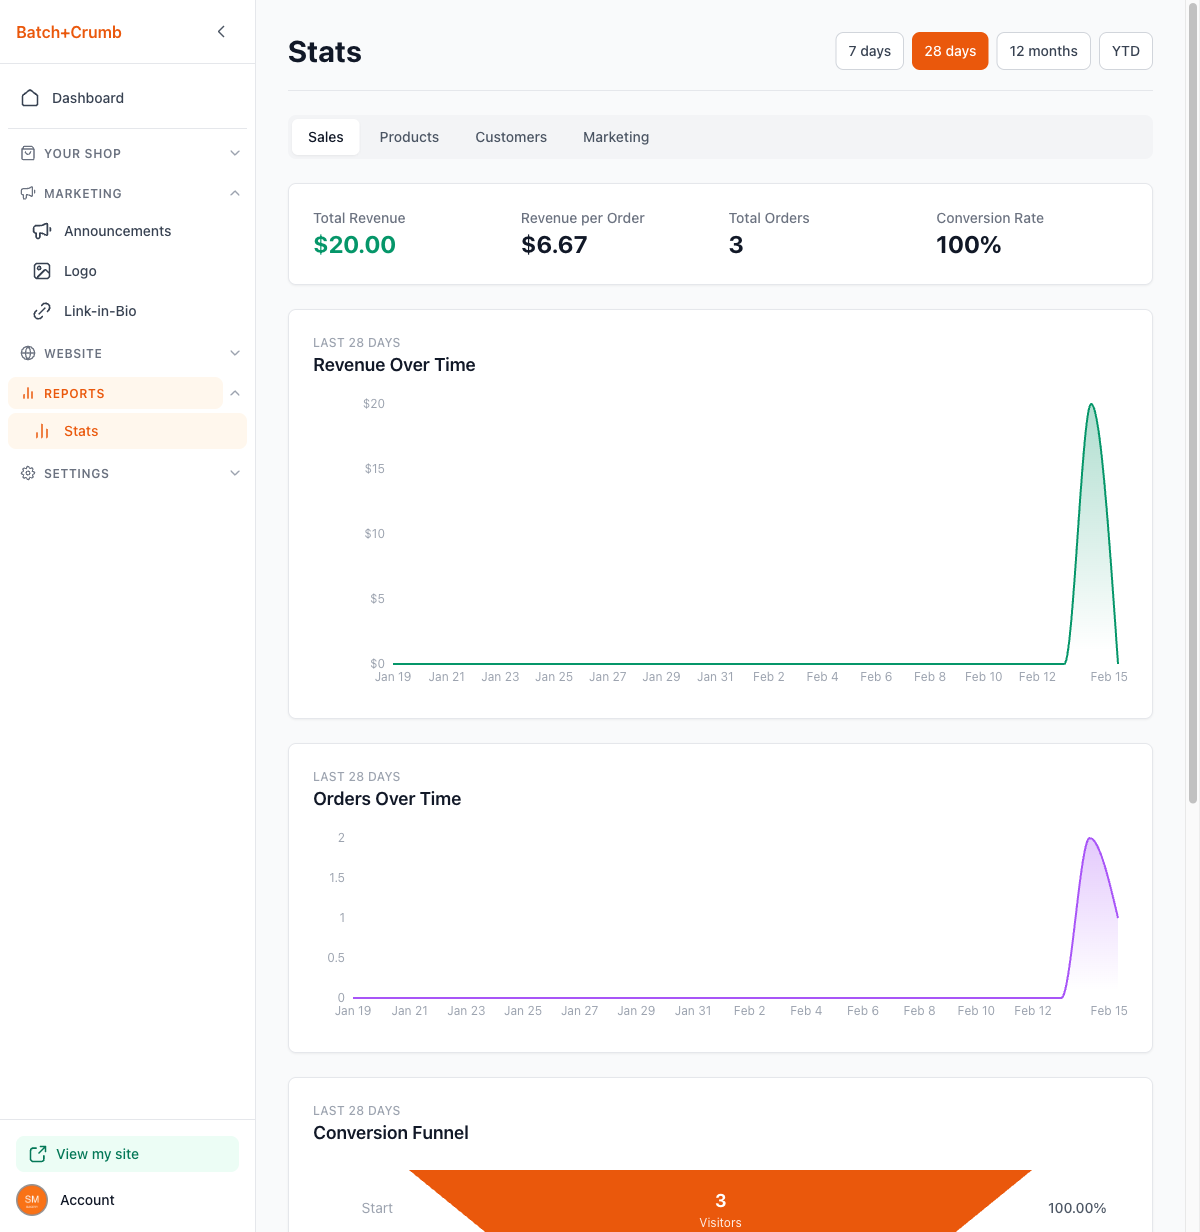
3. Review your revenue summary
At the top of the Sales tab, four summary cards give you a quick snapshot:
- Total Revenue — how much you've earned in the selected period
- Revenue per Order — your average order value (total revenue divided by number of orders)
- Total Orders — how many orders came in
- Conversion Rate — the percentage of site visitors who placed an order
4. Check revenue and order trends
Below the summary cards, two line charts show how your sales are trending:
- Revenue Over Time — a daily breakdown of your earnings, so you can spot your busiest days
- Orders Over Time — how many orders you received each day
These charts make it easy to see patterns — like whether weekends are busier than weekdays, or if a particular promotion drove a spike in sales.
5. Understand your conversion funnel
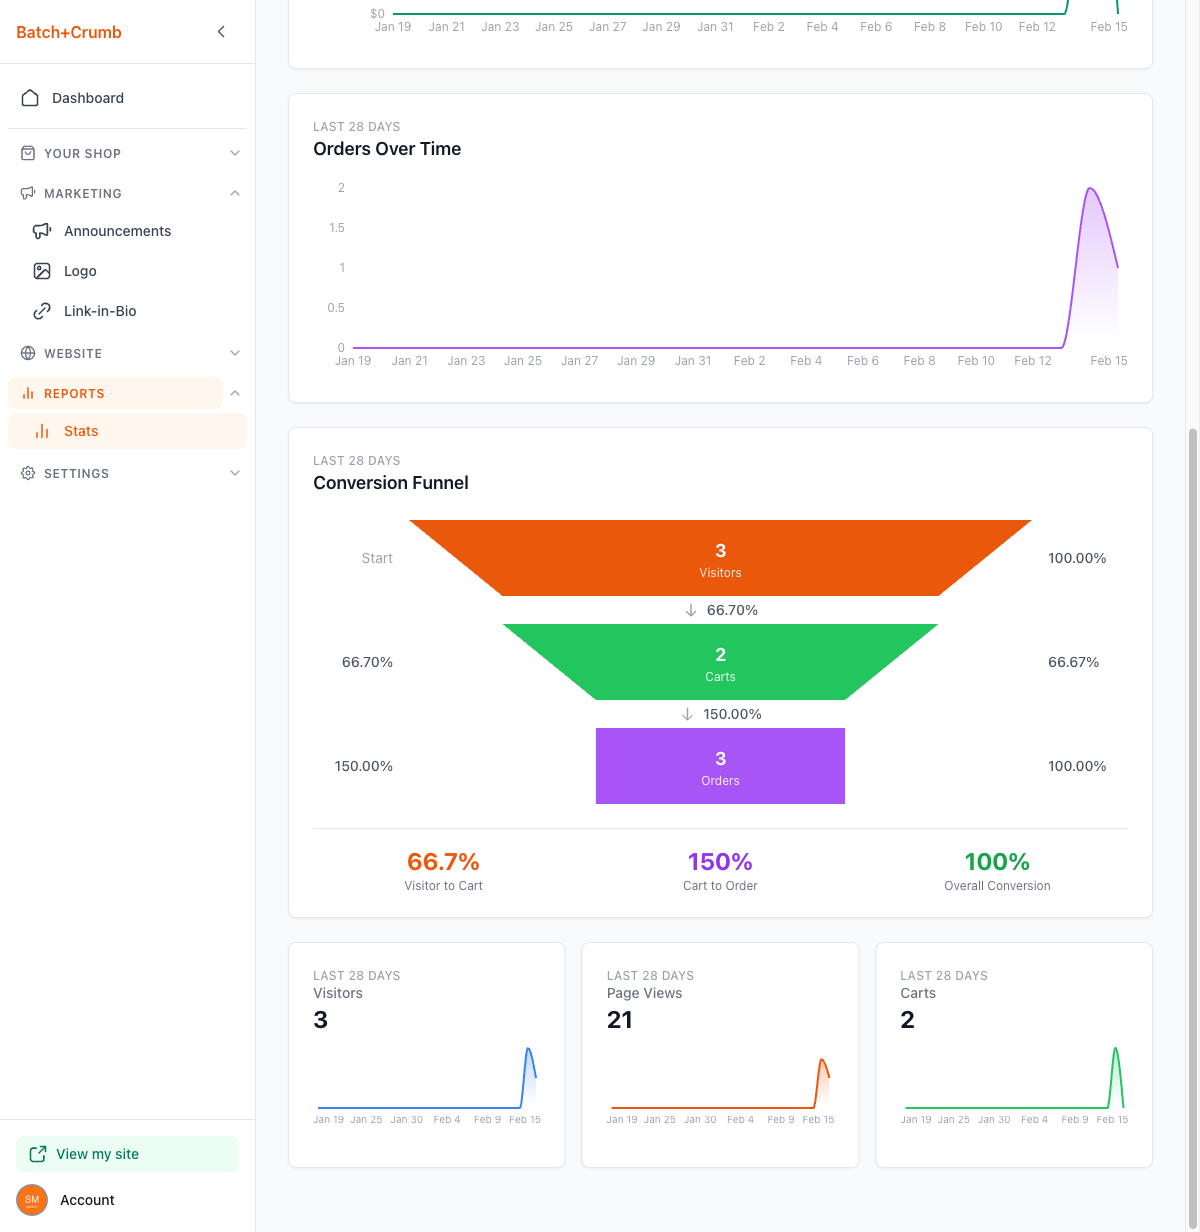
The Conversion Funnel shows how visitors move through your shop:
- Visitors — people who came to your site
- Carts — visitors who added something to their bag
- Orders — people who completed checkout
Between each stage, you'll see the conversion percentage. At the bottom, three summary numbers show your Visitor to Cart, Cart to Order, and Overall Conversion rates.
Below the funnel, three mini sparkline charts track Visitors, Page Views, and Carts over time so you can see traffic trends at a glance.
6. See your top-selling products
Click the Products tab to see which items are bringing in the most revenue.
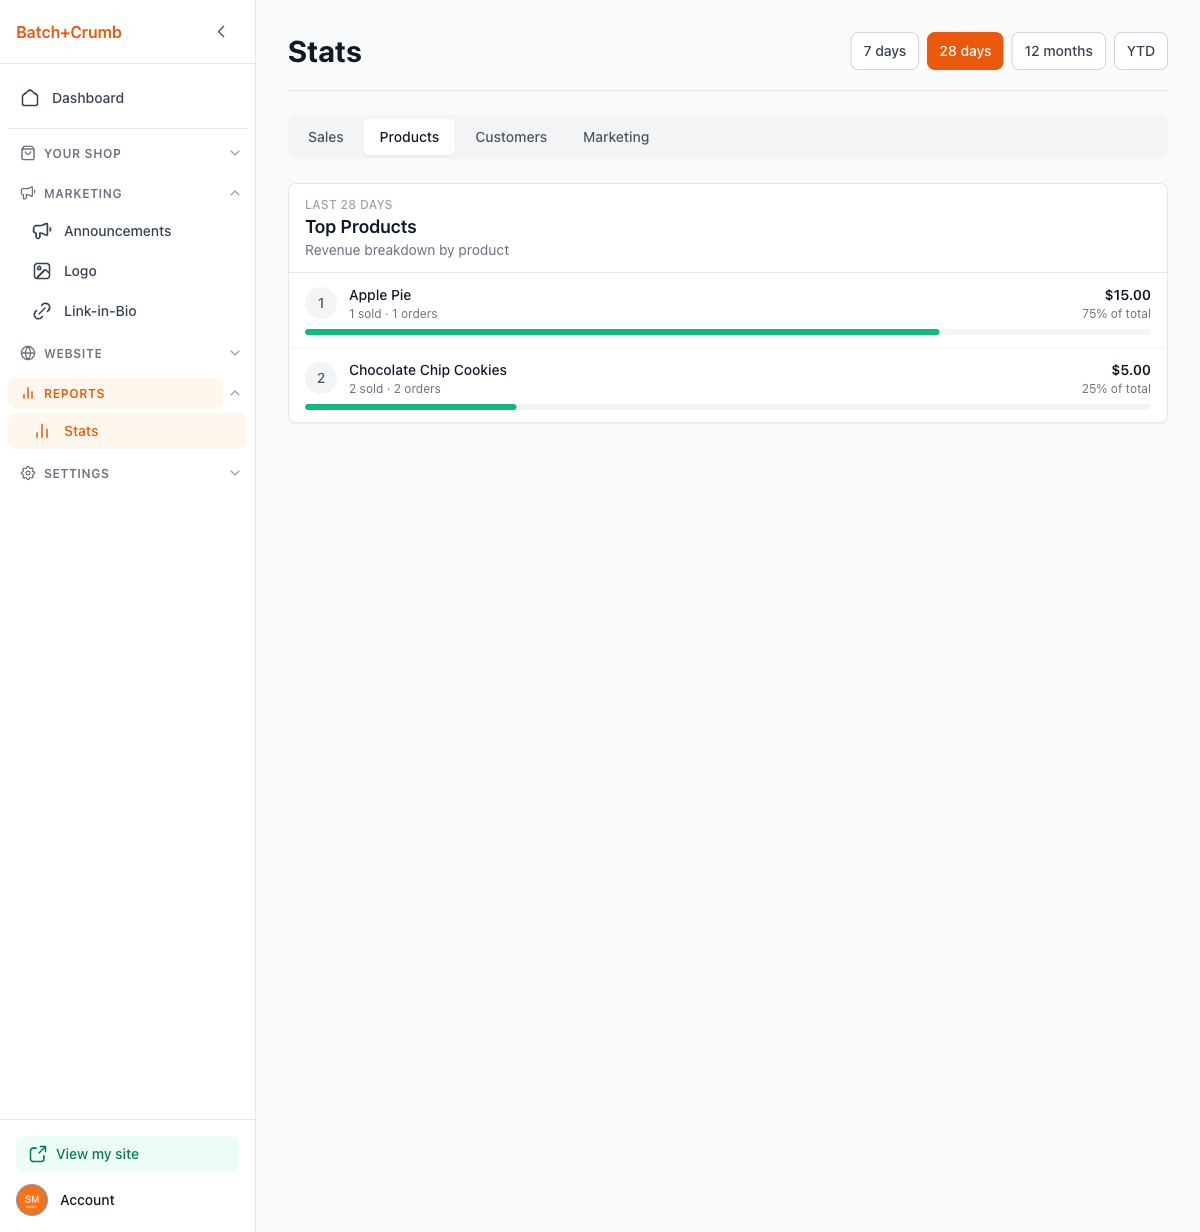
The Top Products section ranks your products by revenue. Each product shows:
- The product name and how many units were sold across how many orders
- The total revenue amount and its percentage of your overall sales
- A progress bar showing its share compared to your top seller
Tips
- Check the Products tab before a big baking weekend to see what's been selling well — it takes the guesswork out of planning your batches.
- If your Revenue per Order feels low, consider adding bundle deals or complementary products (like cookies + jam) to encourage bigger orders.
- Watch the Conversion Funnel to spot where customers are dropping off. If lots of people add items to their bag but don't order, your checkout experience or payment options might need a tweak.
- Switch between time periods to compare — for example, check 7 days after running a promotion to see if it made a difference.