Understand Your Performance Metrics
Track how well your site converts visitors into customers with your conversion funnel, traffic trends, and customer insights.
Pro plan feature — Upgrade to Pro to access this feature.
Track how well your site converts visitors into customers with your conversion funnel, traffic trends, and customer insights.
Overview
Your Stats page includes powerful performance metrics that go beyond basic sales numbers. The conversion funnel shows you exactly where visitors drop off — are they browsing but not adding to their bag? Adding to their bag but not checking out? These insights help you figure out what to tweak so more visitors become paying customers.
Steps
1. Check the quick summary on your Dashboard
Direct link: Open this page
Your Dashboard includes a Traffic & Performance section that gives you a quick snapshot of the past 30 days — Visitors, Carts, Orders, and Revenue all at a glance.
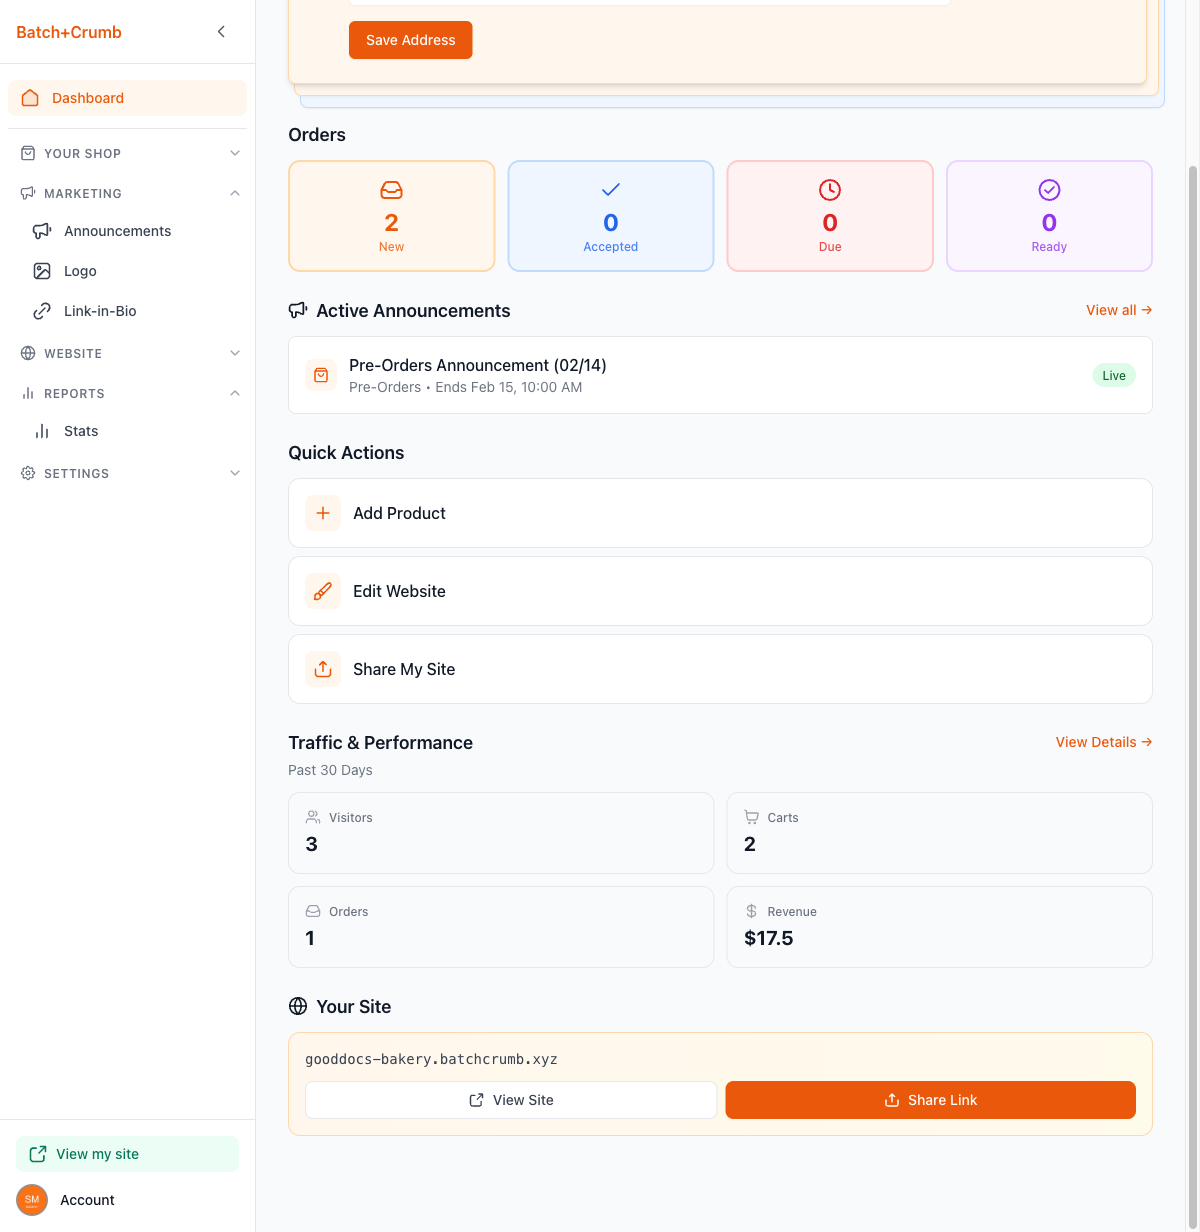
Click View Details → to jump straight to the full Stats page.
2. Open the Stats page
From your admin sidebar, click Reports to expand the section, then click Stats. The Sales tab opens by default, showing your summary cards and charts.
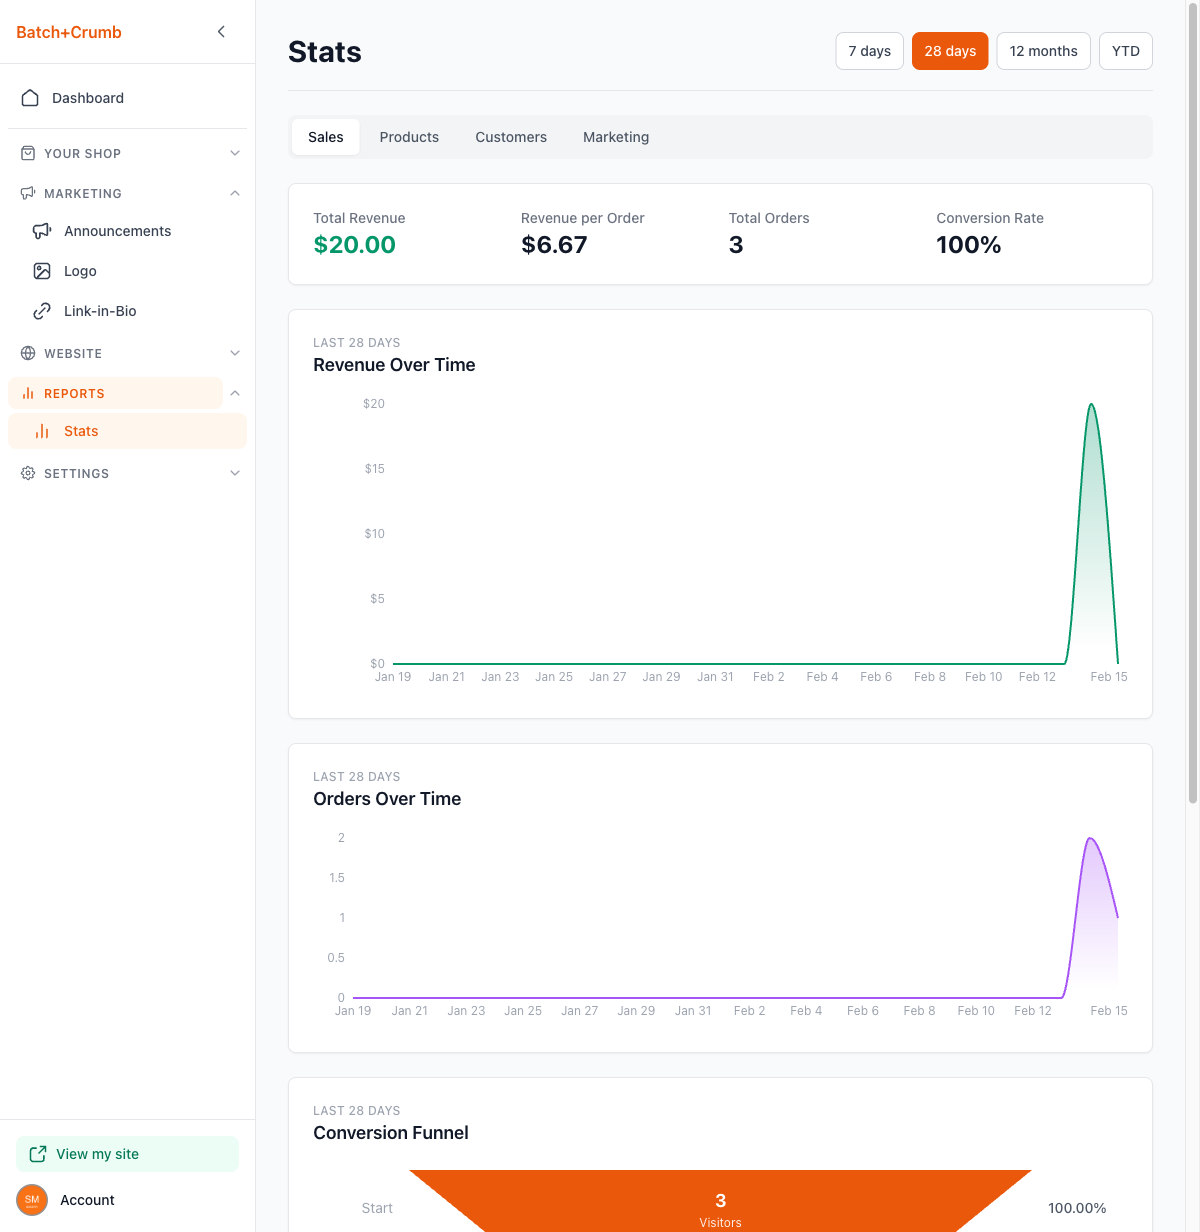
At the top, four summary cards give you the big picture:
- Total Revenue — how much you've earned
- Revenue per Order — your average order value
- Total Orders — number of completed orders
- Conversion Rate — percentage of visitors who placed an order
3. Read your Conversion Funnel
Scroll down on the Sales tab to find the Conversion Funnel. This is where the real performance insights live.
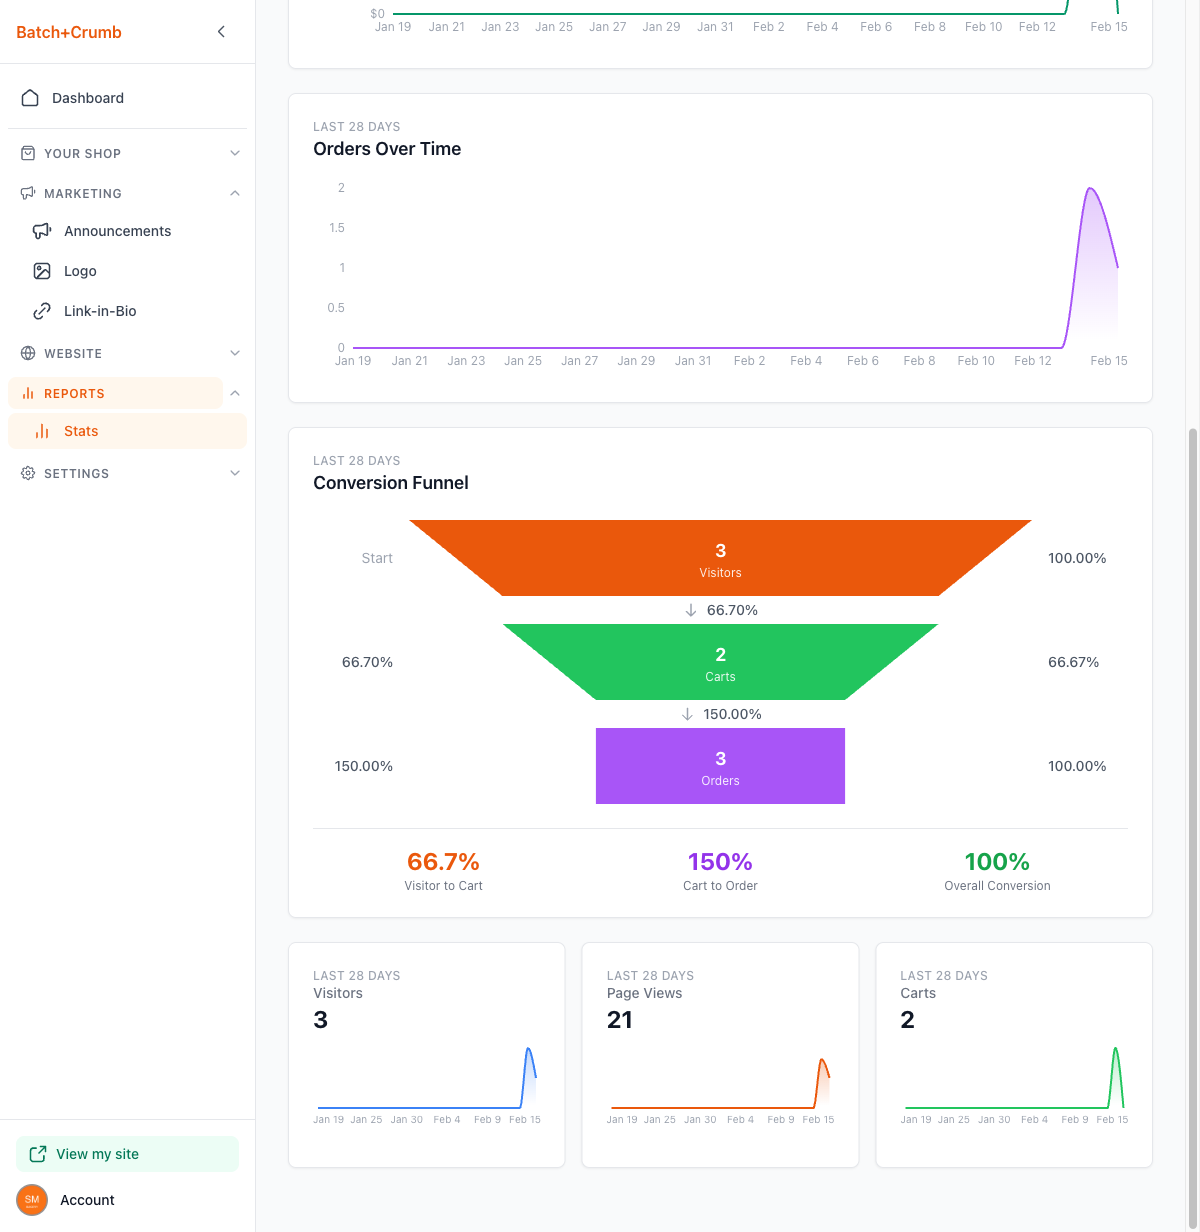
The funnel shows three stages:
- Visitors (orange) — everyone who came to your site
- Carts (green) — visitors who added something to their bag
- Orders (purple) — people who completed checkout
Between each stage, you'll see the conversion percentage — this tells you how many people moved to the next step. At the bottom, three summary numbers break it down:
- Visitor to Cart — what percentage of visitors added something to their bag
- Cart to Order — what percentage of people with items in their bag actually checked out
- Overall Conversion — what percentage of all visitors ended up placing an order
4. Monitor your traffic trends
Below the funnel, three mini sparkline charts show how your traffic is trending over time:
- Visitors — unique people visiting your site
- Page Views — total pages viewed (one visitor can view many pages)
- Carts — how many shopping bags were created
These sparklines help you spot patterns — like whether a social media post drove a spike in visitors, or whether traffic is growing steadily over time.
5. Explore customer performance
Click the Customers tab to see how your customer base is performing.
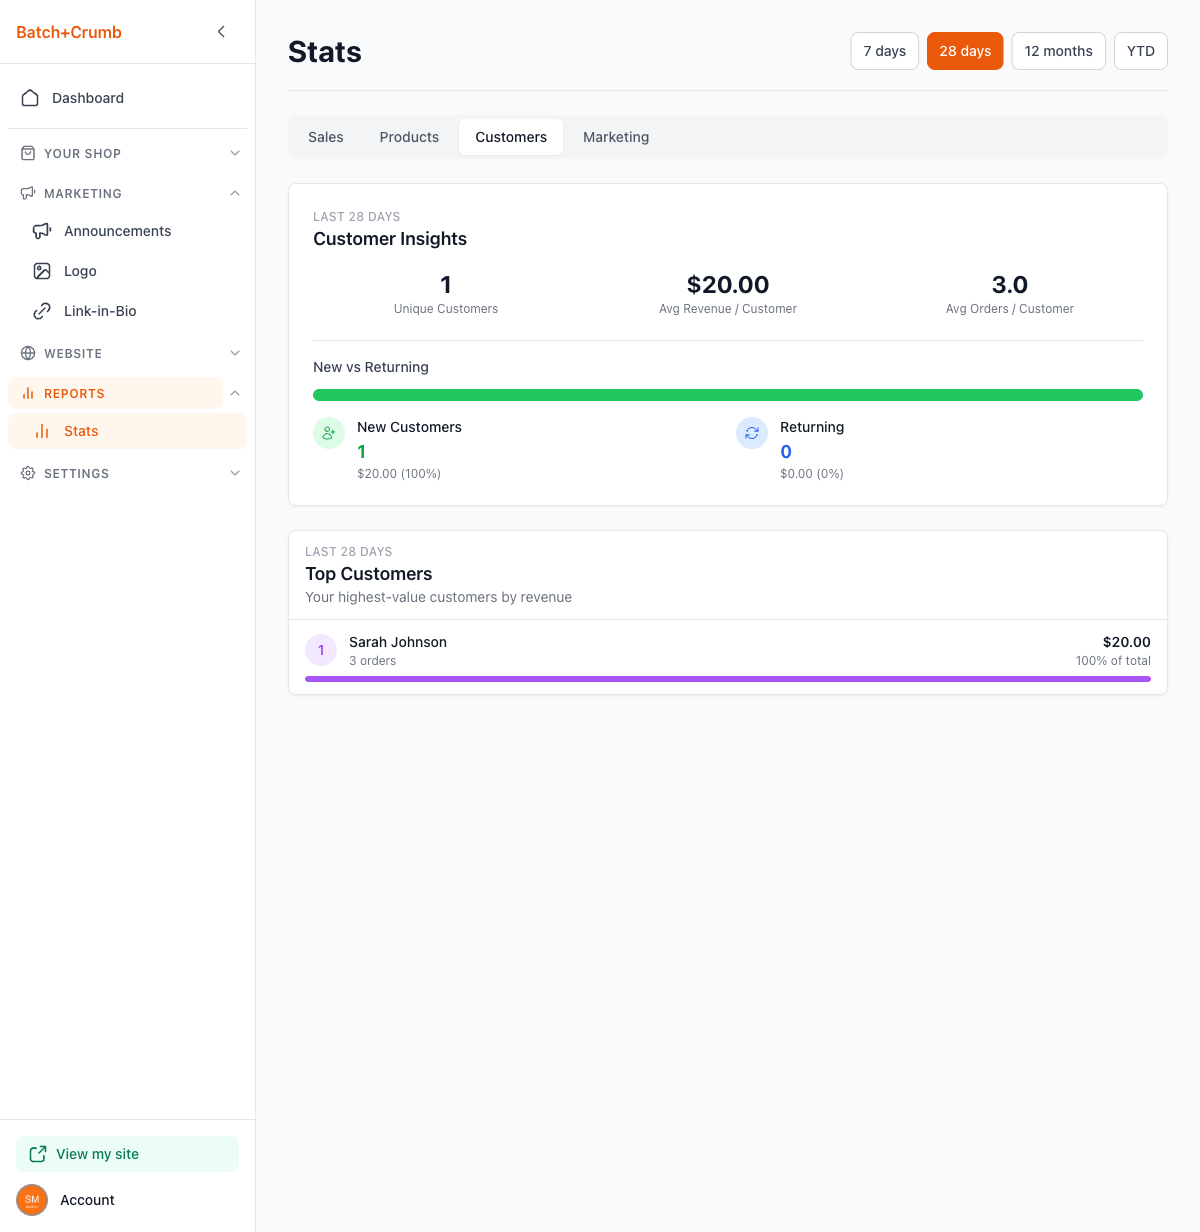
Customer Insights at the top shows:
- Unique Customers — how many different people ordered
- Avg Revenue / Customer — how much each customer spends on average
- Avg Orders / Customer — how often each customer orders
The New vs Returning section shows whether your sales are coming from first-time buyers or repeat customers, with revenue breakdowns for each group.
The Top Customers section ranks your highest-value customers by total revenue.
6. Change the time period
Use the buttons at the top right to adjust the time range:
- 7 days — the past week
- 28 days — the past four weeks (selected by default)
- 12 months — the past year
- YTD — year to date
All charts, funnels, and numbers update automatically when you switch.
Tips
- If your Visitor to Cart rate is low, your product photos or descriptions might need some love — visitors are looking but not feeling tempted to add anything.
- If your Cart to Order rate is low, something might be tripping people up at checkout. Double-check that your payment methods and pickup details are clear.
- A healthy Overall Conversion rate for a cottage food business is typically 2–10%. Don't worry if yours seems small — even a small improvement can mean a lot more orders.
- Check the New vs Returning split regularly. A healthy mix of both means you're attracting new customers while keeping your regulars coming back.
- Compare different time periods to see the impact of changes you've made — like updating product photos, running an announcement, or sharing your site on social media.